DEAR USER, we still develop features that are listed here. This is actively developed and can be awaited duo the following quarter.

Asset research at it's finest

We help you to find better investments
Try it for Free
Popular lookups → Microsoft Apple Inc. Nvidia
0

Stocks

0

ETFs

0

Forex

free

Access

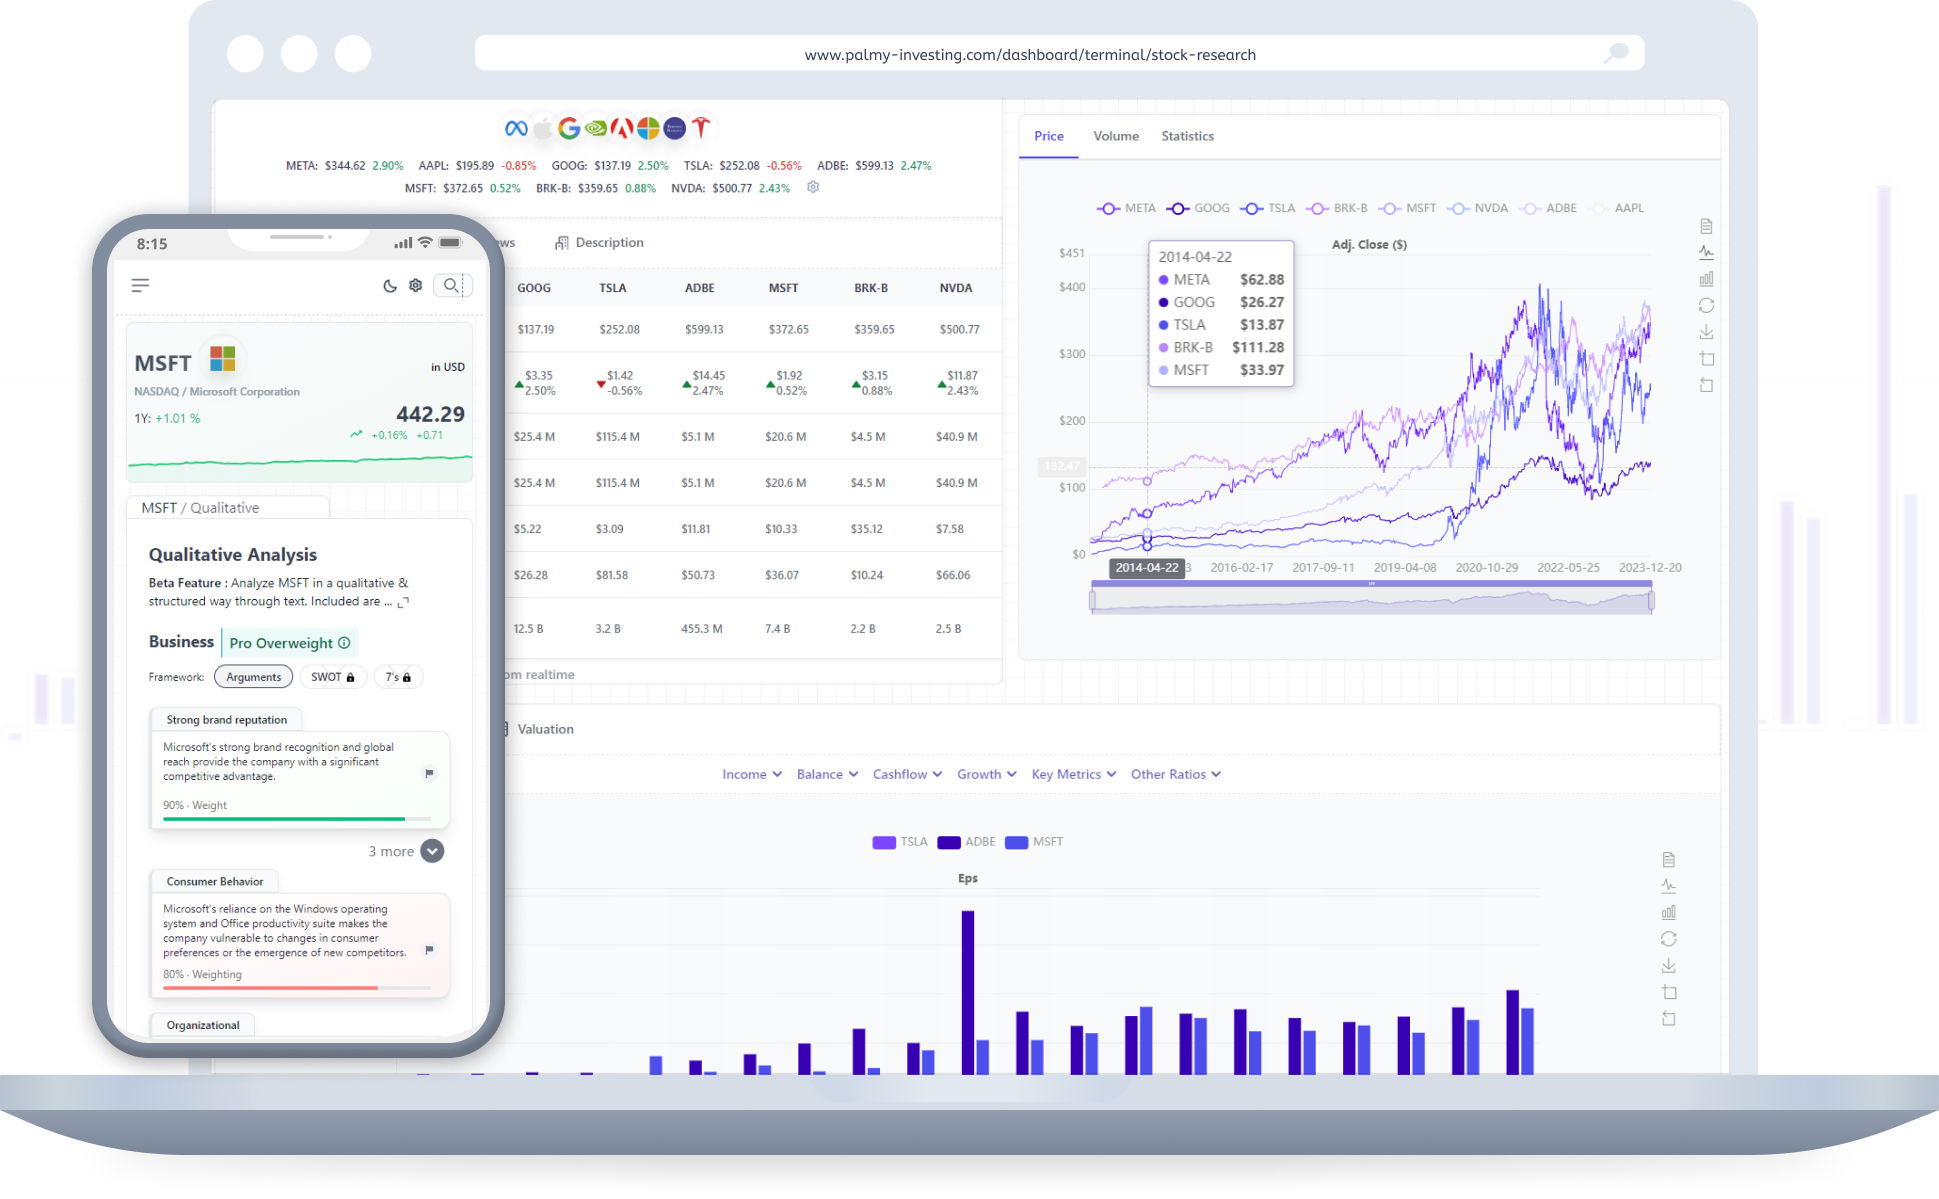
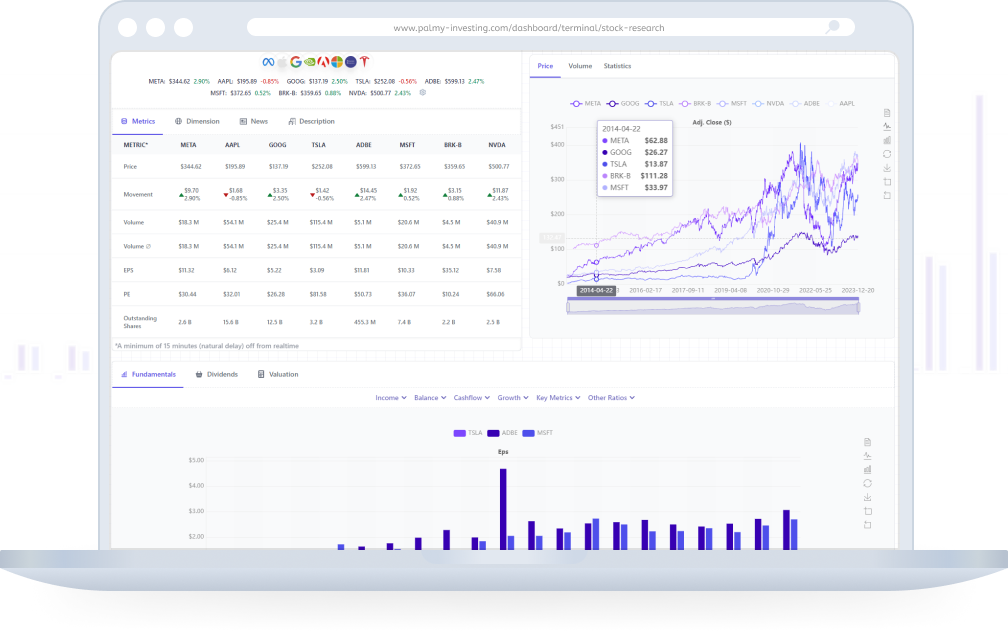
terminal mockup that shows a simplified analytics view

I. Powerful investment platform

terminal icon

Terminal

Every profit results from a qualitative research.

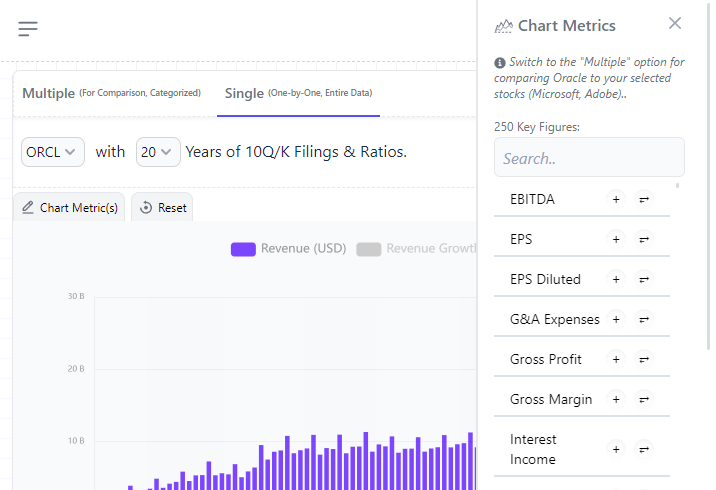
Our customizable terminal let you compare and chart all financial figures. It comes with a lot of utilities such as multi-search, peer analytics & risk profiles.

portfolio icon

Portfolio

Our portfolio manager stands out from the majority

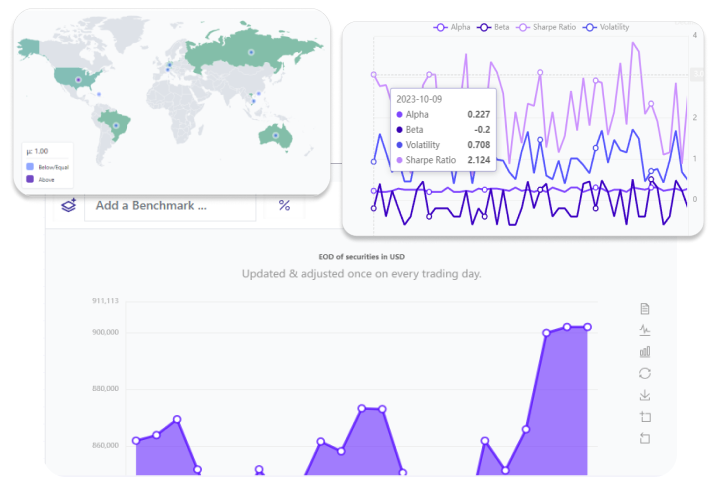
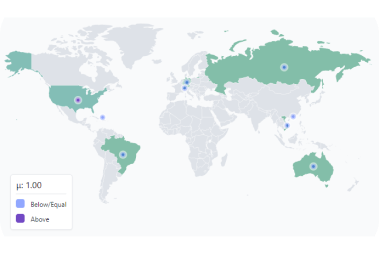
Dive deep into our analytics, where you find country and sector allocation as well as our Portfolio Metrics (e.g. the Sharpe Ratio). Track your portfolios value with ease and compare it with any benchmark.

financial utils icon

Utils

Our range of solutions is large and constantly growing

Create a watchlist, table or score. Utilize our screeners & tools for quick ideas during you're research workflow to discover better investments.


Terminal power

Organized research

  • There is no need to open 10 tabs to compare 10 stocks.
  • Our multi-search tool allows you to compare stocks within a single page. The terminal is optimised to deal with your research targets all together.

Advanced data presentation

  • Customizable and data rich research.
  • Our terminal works with 30+ years of financial data and counts more than 300 financial metrics. With that you are able to customize every chart, table and model - Make it as unique as you are.

Events and impact

  • React faster and stay up to date.
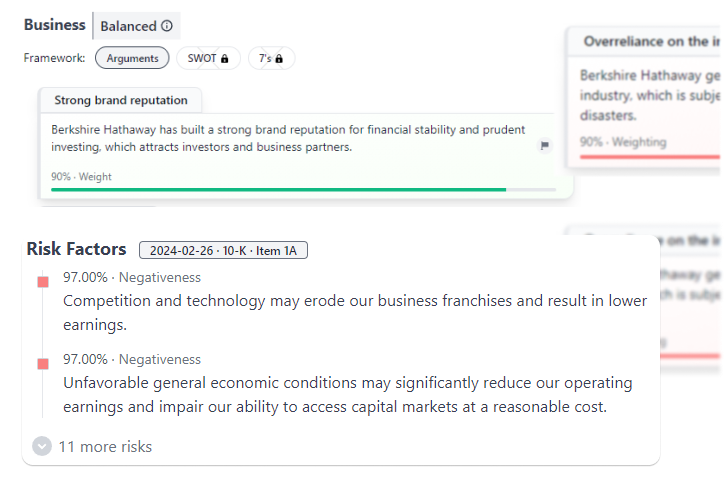
  • At these times things start to change more frequently. That's why we publish reports, social sentiments and news as fast as possible.
Seeing is believing
Start your research for free to see the terminal in action.
Terminal use case image for organized research
Terminal use case image for data representing
Terminal use case image for news, reports and events

Portfolio management

A line chart as icon for representing the portfolio value
Portfolio Value
Track your asset performance from your first purchase until today - We provide historical charts for all of your portfolios
An icon image for representing portfolio metrics (also: KPIs)
Portfolio Metrics
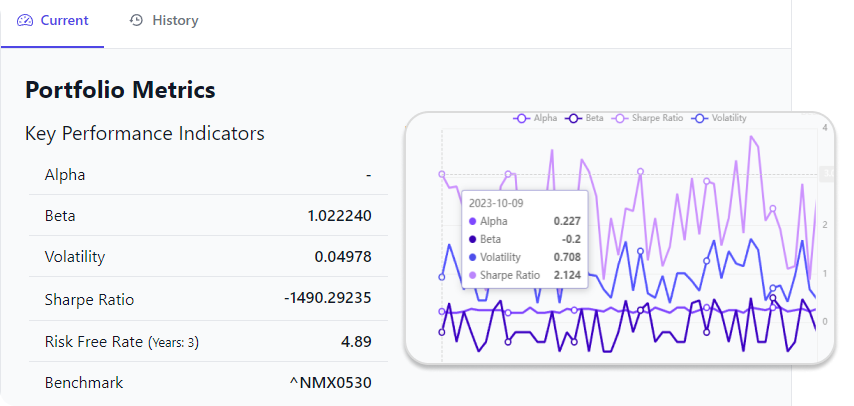
We offer everyone the opportunity to use our portfolio metrics for analysis. Among others we calculate the Sharpe Ratio, the Alpha, the Beta and the Volatility of your portfolios.
allocation icon for the portfolio
Allocations
Our dashboard visualizes your portfolio allocation - Asset classes, weighting, sectors or countries, we provide all the statistics to your dashboard
benchmark icon for the portfolio
Benchmarks
Use one of more than 150 benchmarks such as the S&P 500 or Dow Jones to compare it with your portfolio value.

Financial Utils

Data Table

Up to date tables. Multi stocks & multi key figures.

Watchlist

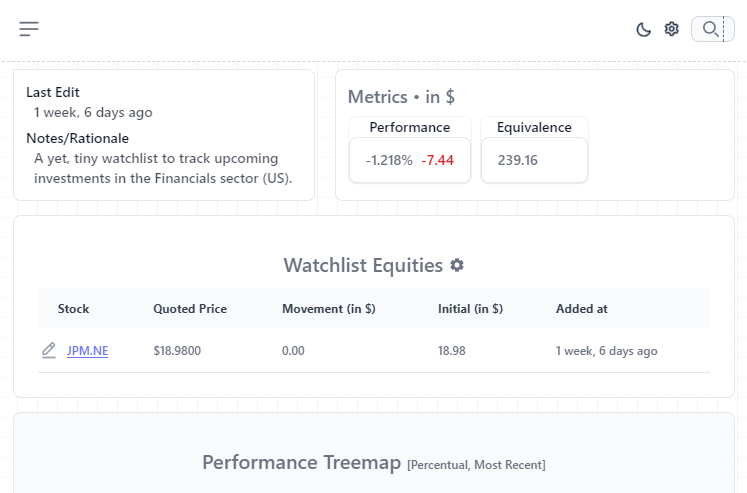
Track ETFs and Stocks at lightspeed.

Formula

Execute formulas based math. key figure operations

Screener

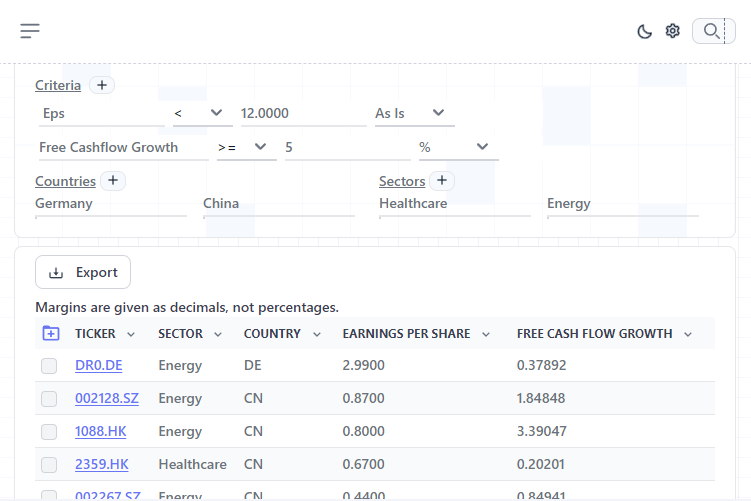
Make 38 screener yours - fully customizable. Most are for stocks, some for forexes & ETFs.

Extras

Currency converter, Macro insights & Alternative data

II. We build for every investor

For

We actively democratize and improve access to investment theory & research.

See how our solutions differ from others

students working with palmy investing
Students

We're here to assist you in taking your first steps into investing. Our mission revolves around offering a platform that grows in tandem with your journey, ensuring your progress every step of the way.

retail investor working with palmy investing
Retail Investors

Elevate your investment strategies with our comprehensive solutions, guiding you towards financial mastery. Your trust is invaluable, and we present optimal plans to honor that trust and drive your success. Embark on your journey to financial freedom with us.

pro. investor as a user of palmy investing
Professionals

Professional investors especially profit from our portfolio management system. We work hard to improve our platform to fulfill your requirements for the long term.

enterprises that use palmy investing
Enterprises

We will soon include solutions for enterprises. Until then you can use our plans and scale you're infrastructure with them.

Our mission &
The future of Palmy Investing

We need to move forward, both with quality and quantity of data. In the following years we position as a premium resource for asset research & portfolio management.

Learn how


III. Plans & Pricing

Students 50% off, annual.
Not sure which is the best fit? Read our comparison

Member

Free / per seat

  • Terminal
  • Unlimited data, no restrictions*
  • Custom data settings& appearance
  • Chart & Table downloads
  • 5 concurrent stocks
  • Portfolio Management
  • 1 portfolio
  • Alpha, Beta, Sharpe Ratio, Volatility
  • S&P 500 as fixed benchmark
  • Allocation analytics for assets, asset classes and countries **
  • Screeners (ETF and Stocks)
  • Dividend tracker, historical growth and analytics
  • Financial Utils
  • Research on Alternatives, Forex and ETFs
  • 3 Watchlists (10 assets each)
  • 1 Formula/Score (5 stocks each)
  • 1 Data Table (10 stocks & metrics each)
Get started

Master +

24.99 / month / per seat

  • Portfolio Management
  • Investor+ Plan
  • 3 15 portfolios
  • 3 Unlimited benchmarks
  • Ghost Access
  • Financial Utils
  • Members Plan
  • 10 50 Watchlists (100 assets)
  • 5 15 Formula/Score (30 stocks)
  • 5 20 Data Tables (60 stocks, 40 metrics)
  • Extras
  • Investor+ Plan
  • Early access (pre beta)
  • Palmy events ***
Subscribe

*This makes us unique. We won't charge based on data quantity, but on quality & advancements.
**Presented in realtime.
***Yet a concept, we start meetings, conferences when our community growth allows it.

Companies from all exchanges, markets, and countries